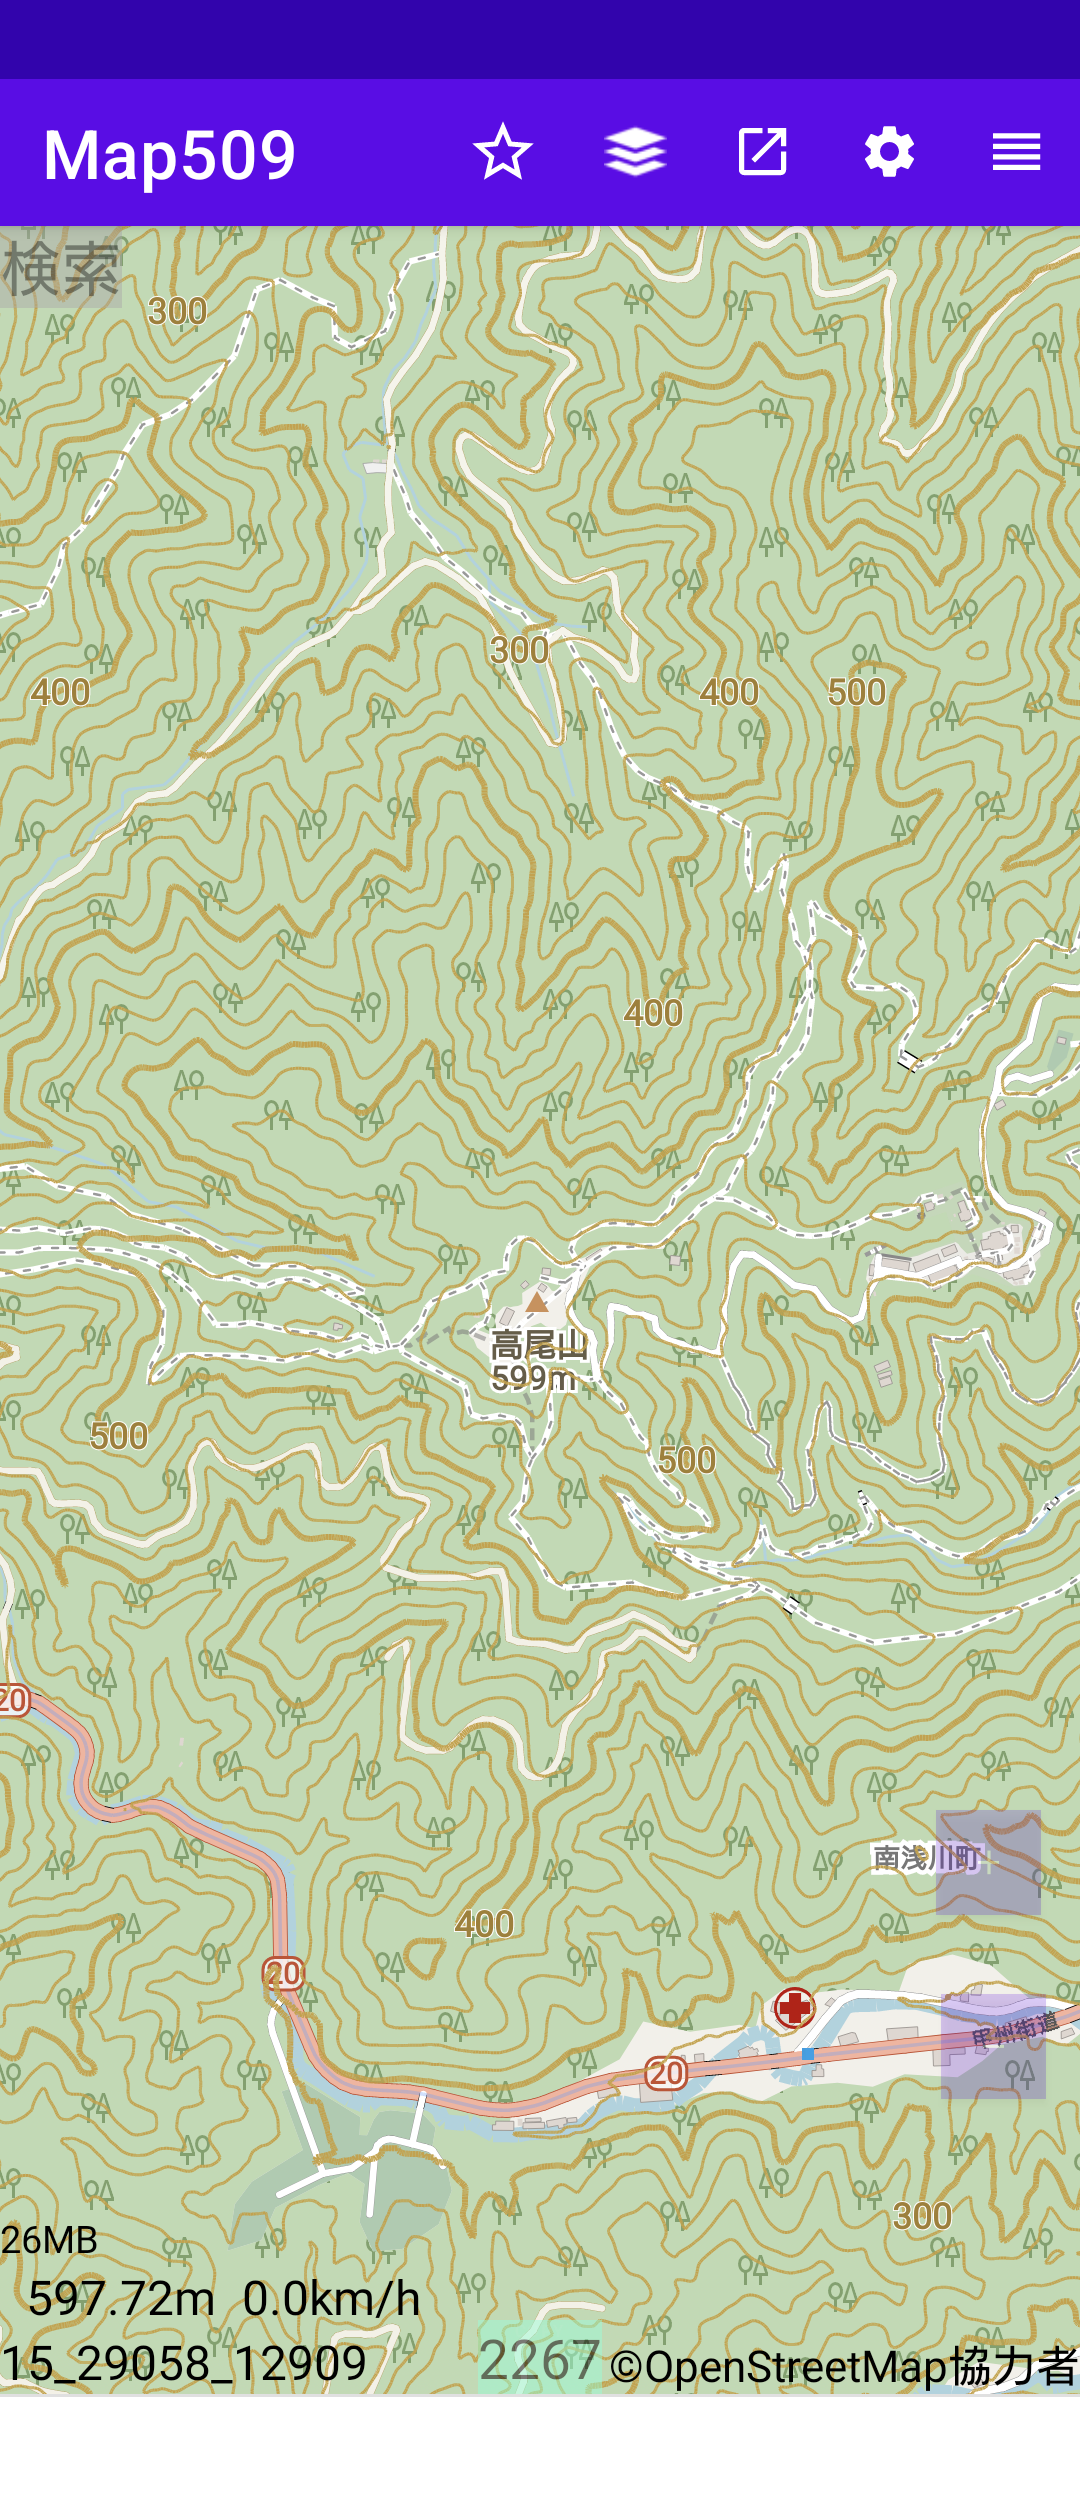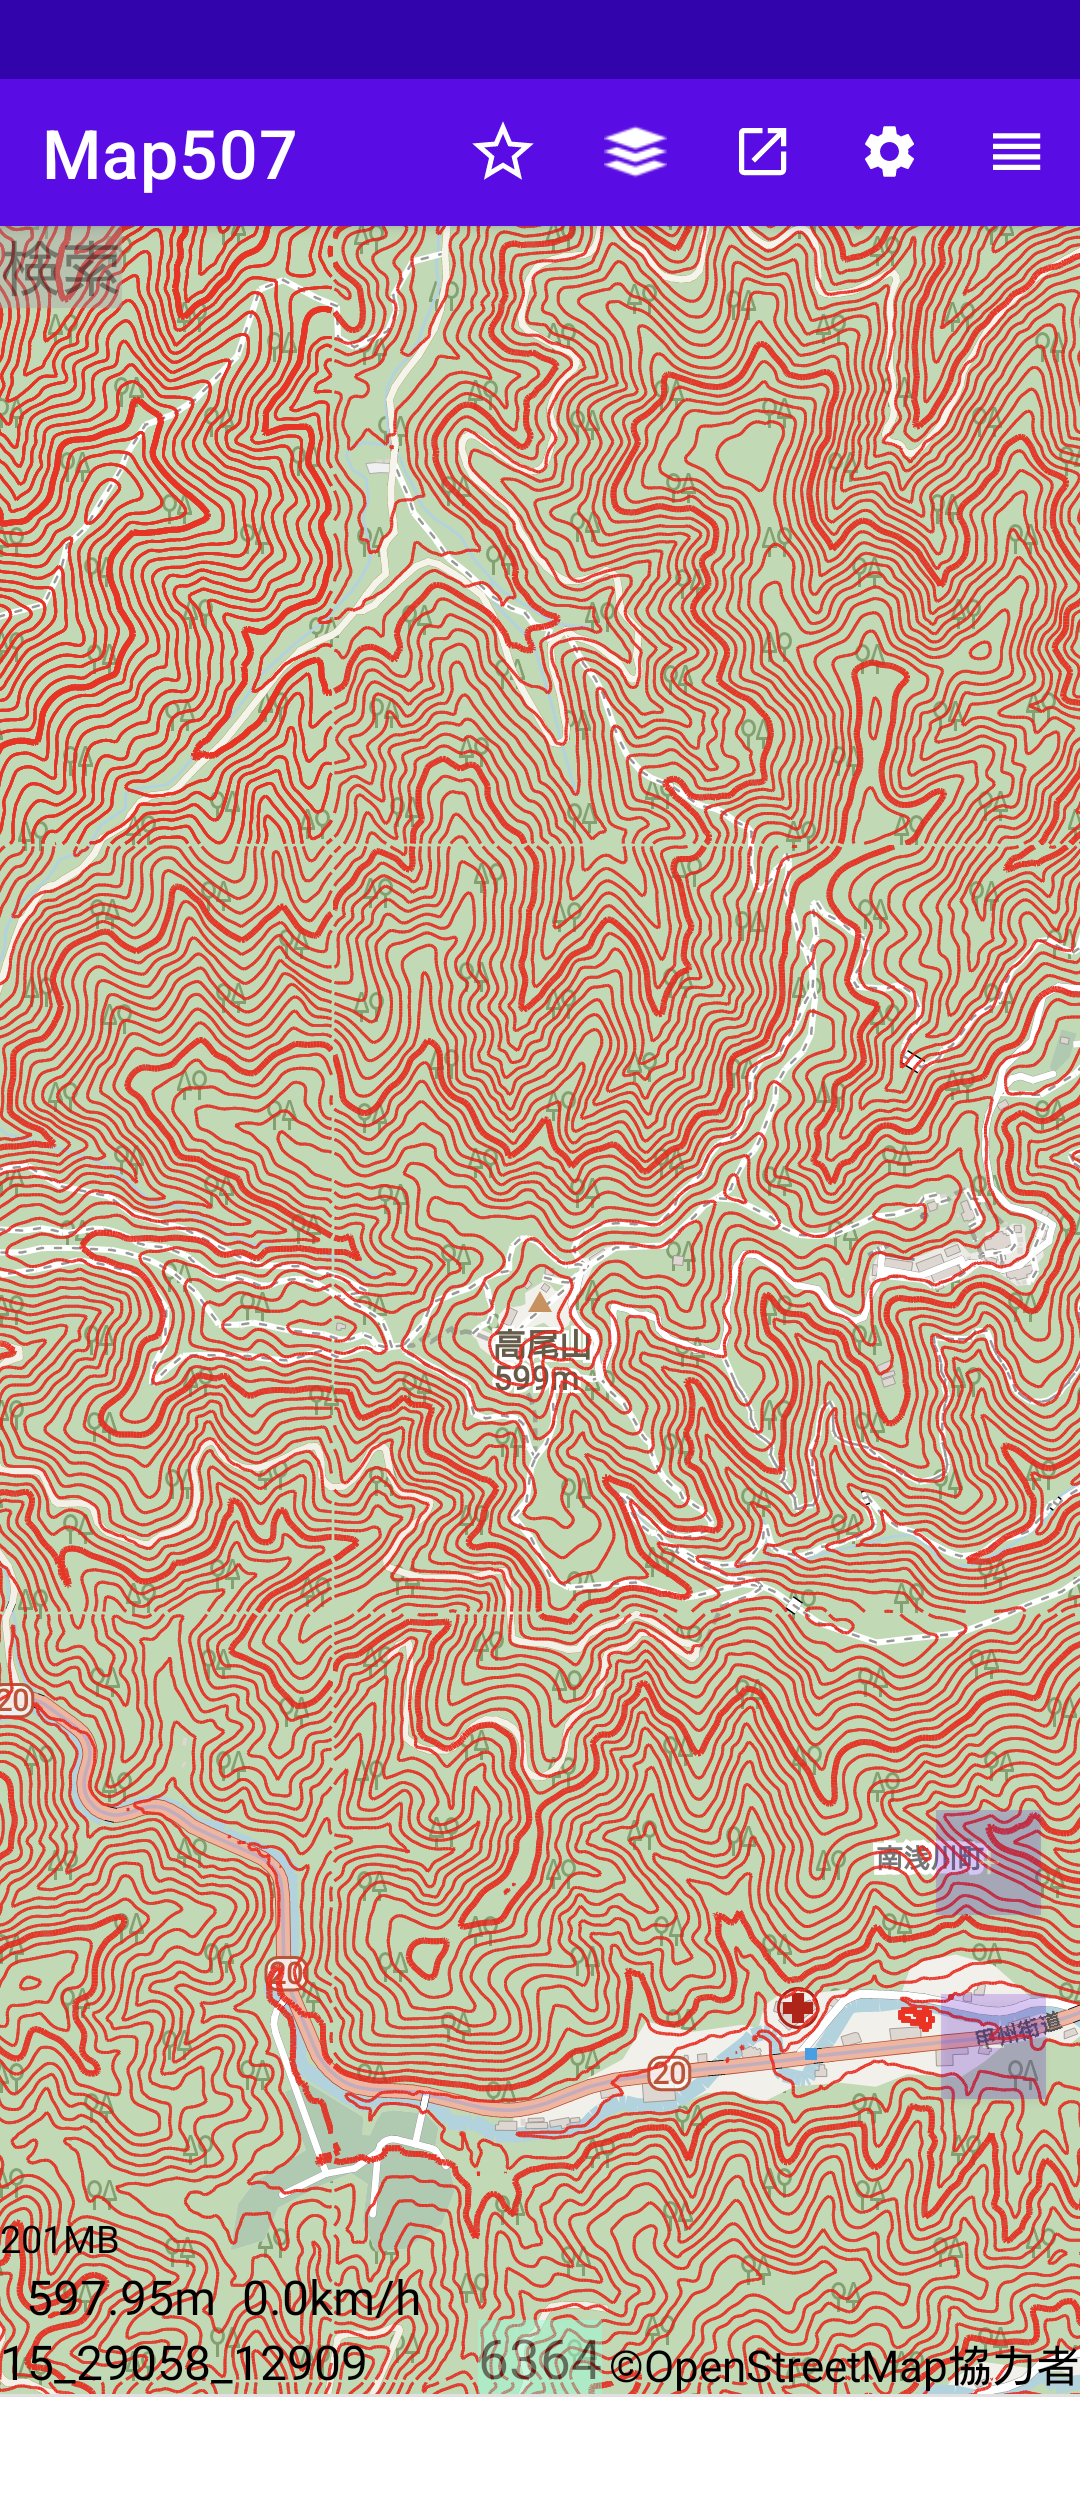
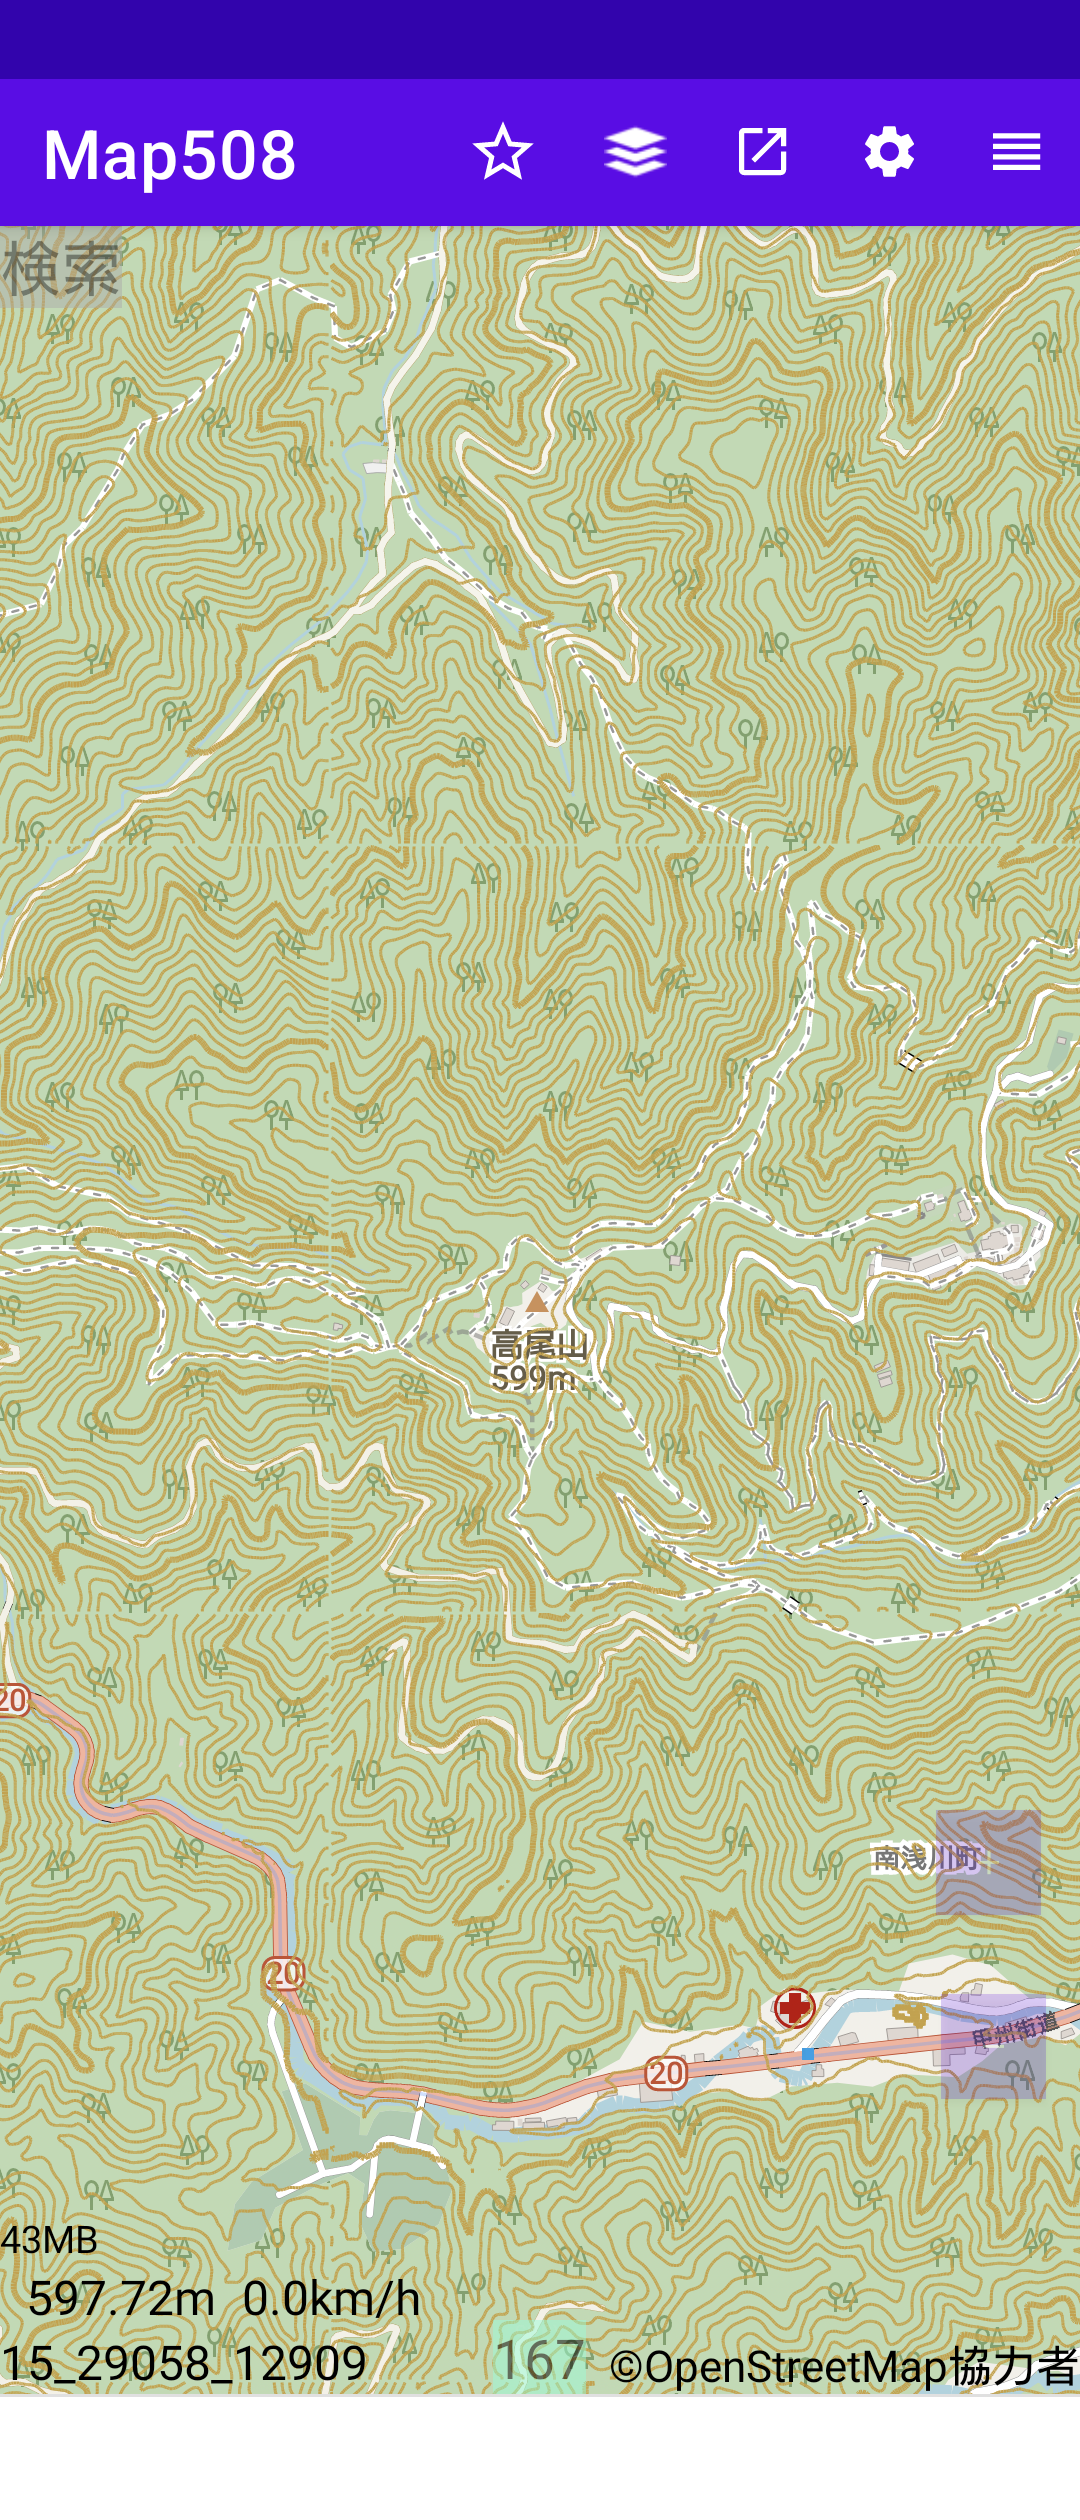
Map4から国土地理院の標高データを使って、地図中心の標高をOSM地図の左下に表示している。
国土地理院地図の等高線データが直接的に提供されているならば、それを利用すればいいが、 今のところ、少し手がかかるようである。
特定範囲のzoomで、現在の地図表示範囲について、標高データから実時間で等高線を求めて 表示できるならば、それで十分である[4]。 ハイキングするときなど、どのコースを選ぶかなどに使いたい。
国土地理院地図相当の等高線データを事前に作成するのと標高データから等高線データを作成するのと いずれが楽か。急ぐ話ではないので、試行錯誤してみよう。
等高線が欲しいのは主に山を歩く時である。zoom 16~18 の山は等高線が中心である。 道路や川もあるが、色で区別できる。
色で判別して等高線データ以外を消した場合、道路、文字、川などとの重なりで所々、 等高線が消えるが支障ない。
このようにして得た等高線画像をOSM地図に重ねるのは簡単である。例えば、zoom 18 で作成し、 それを zoom 16~21 で重ね表示する。zoom 16、17 では縮小、zoom 19~21 では拡大して重ねる。
まずは、拡大・縮小はなく、zoom 16~18 で等高線データを抽出して、重ねてみる。 等高線データより、ほかの情報が多い市街地タイルは除外する。
市街地では等高線の色に近い色があれこれ使われているため、山中でなければ、等高線抽出が難しいであろう。
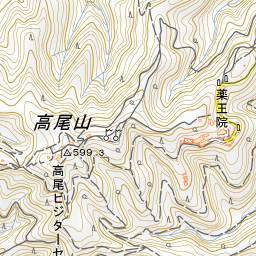
太い等高線の色は 0x976F0A、0x97700B、細い等高線の色は 0xE3CF9D, 0xDAC07E であり、土手は 0xCAA343、建物枠線は 0xFF9F69 である。 判定では幅を持たせるが、等高線と似た色の区別はできるであろう。 2か所のチェックでは、太線は大差ないが、細線では差が大きい。もっと多くのファイルで調べる必要があるだろう。
5mメッシュデータ(zoom 15)は日本全土に対してあるとは限らないが、東京の高尾山山頂を含むタイルや 岡山の備中松山城跡を含むタイルは存在することを確認した。
文献[5]に、この標高データを使って、簡単に等高線を得る方法が載っている。 この方法では、zoom 15のタイルで太さ1画素の等高線を求める。zoom 16で、単純に縦横2倍にすると、線の太さが2画素になる。 zoom 17、18 では太さが 4画素、8画素になる。精度は低下し、線が太くなりすぎるので、線を細くする処理がいる。
zoom 15で等高線をベクトル化すれば、任意のzoom で線の太さは自由に選べ、滑らかな等高線が得られる。 しかし、標高データから等高線べクトルデータを得るのは容易ではない[6]。
まずは、文献[5]の方法を試したい。zoom 16 については、zoom 15で隣合う画素の中間値を使い、 zoom 15のタイルを縦横2倍にして、4つのタイルにする。これにより、線の太さはzoom 15と同じ1画素となる。
この方法は、zoom 17、18 にも適用できるが、中間値で拡大するため、徐々に誤差は大きくなる。 2点の中間値ではなく、4点、6点、8点、… を使って中間点の座標値を計算すれば精度が上がる。
まずは、2点の中間値として、等高線を描いてみて、結果を見てから先に進みたい。
この場合、等高線ピッチを1、2mにして市街地道路の坂道のきつさ、ゆるさを表示することもできる。
例えば、zoom 17の地図表示中に、初めて、等高線表示を求めた場合、zoom 17の等高線タイルがないため、 zoom 16のタイルを求める。zoom 16もない場合、zoom 15 を求める。最初に、zoom 15の等高線タイルを作り、 これをファイルに保存するとともに、zoom 16の標高データタイルを4つ作り、それぞれファイルに保存する。 そのうちの一つを使って、zoom 17の標高タイル4つを作り、そえぞれファイルに保存する。 そのうちの一つが当面のレスポンスタイルとなる。他の3タイルも引き続きリクエストされる可能性が高い。 すでにファイルが作られているため、それを読み込むだけで済む。zoom 17 はなくても、zoom 16 があるケースもありうる。 その時は、zoom 15までは下りず、zoom 16の標高データタイルから同じようにして、zoom 17のタイルを作る。
このような再帰処理は後回しにして、まずは、zoom 15 でのみ等高線表示を行う。
1画素ずつその標高を、右、下、斜めの画素の標高と比較して、等高線の数値が3組中いずれか二つの標高の間に 含まれると、その画素を塗りつぶす。最大1画素の位置誤差が生まれる。 実際の等高線は画素と画素の間のどこかを通る。右、下、斜めに近い場合、 当該画素ではなく、右、下、あるいは斜めを塗りつぶす方が精度があがるであろう。
単純には、zoom 16では最大誤差2画素、zoom 17 では最大誤差4画素となる。
zoom 15の標高データは、zoom 16 では 4(2x2)画素の中心の標高と考えるべきであろう。 タイル全体では 128x128 の標高値からなるべく精度高く 256x256画素の標高値を算出すれば、 zoom 15 と同じ方法で等高線が描ける。
コマンドラインで動かすこともできるので、パソコン(Windows)であれば、地図システムで実時間で 国土地理院の標高データから等高線データを作り出すことができるであろう。 Android OS でも使える可能性がある。
/*
   Derivation from the fortran version of CONREC by Paul Bourke
   d               ! matrix of data to contour
   ilb,iub,jlb,jub ! index bounds of data matrix
   x               ! data matrix column coordinates
   y               ! data matrix row coordinates
   nc              ! number of contour levels
   z               ! contour levels in increasing order
*/
void Contour(double **d,int ilb,int iub,int jlb,int jub,
   double *x,double *y,int nc,double *z,
   void (*ConrecLine)(double,double,double,double,double))
{
#define xsect(p1,p2) (h[p2]*xh[p1]-h[p1]*xh[p2])/(h[p2]-h[p1])
#define ysect(p1,p2) (h[p2]*yh[p1]-h[p1]*yh[p2])/(h[p2]-h[p1])

   int m1,m2,m3,case_value;
   double dmin,dmax,x1=0,x2=0,y1=0,y2=0;
   int i,j,k,m;
   double h[5];
   int sh[5];
   double xh[5],yh[5];
   int im[4] = {0,1,1,0},jm[4]={0,0,1,1};
   int castab[3][3][3] = {
     { {0,0,8},{0,2,5},{7,6,9} },
     { {0,3,4},{1,3,1},{4,3,0} },
     { {9,6,7},{5,2,0},{8,0,0} }
   };
   double temp1,temp2;

   for (j=(jub-1);j>=jlb;j--) {
      for (i=ilb;i<=iub-1;i++) {
         temp1 = MIN(d[i][j],d[i][j+1]);
         temp2 = MIN(d[i+1][j],d[i+1][j+1]);
         dmin  = MIN(temp1,temp2);
         temp1 = MAX(d[i][j],d[i][j+1]);
         temp2 = MAX(d[i+1][j],d[i+1][j+1]);
         dmax  = MAX(temp1,temp2);
         if (dmax < z[0] || dmin > z[nc-1])
            continue;
         for (k=0;k dmax)
               continue;
            for (m=4;m>=0;m--) {
               if (m > 0) {
                  h[m]  = d[i+im[m-1]][j+jm[m-1]]-z[k];
                  xh[m] = x[i+im[m-1]];
                  yh[m] = y[j+jm[m-1]];
               } else {
                  h[0]  = 0.25 * (h[1]+h[2]+h[3]+h[4]);
                  xh[0] = 0.50 * (x[i]+x[i+1]);
                  yh[0] = 0.50 * (y[j]+y[j+1]);
               }
               if (h[m] > 0.0)
                  sh[m] = 1;
               else if (h[m] < 0.0)
                  sh[m] = -1;
               else
                  sh[m] = 0;
            }

            /*
               Note: at this stage the relative heights of the corners and the
               centre are in the h array, and the corresponding coordinates are
               in the xh and yh arrays. The centre of the box is indexed by 0
               and the 4 corners by 1 to 4 as shown below.
               Each triangle is then indexed by the parameter m, and the 3
               vertices of each triangle are indexed by parameters m1,m2,and m3.
               It is assumed that the centre of the box is always vertex 2
               though this isimportant only when all 3 vertices lie exactly on
               the same contour level, in which case only the side of the box
               is drawn.
                  vertex 4 +-------------------+ vertex 3
                           | \               / |
                           |   \    m=3    /   |
                           |     \       /     |
                           |       \   /       |
                           |  m=2    X   m=2   |       the centre is vertex 0
                           |       /   \       |
                           |     /       \     |
                           |   /    m=1    \   |
                           | /               \ |
                  vertex 1 +-------------------+ vertex 2
            */
            /* Scan each triangle in the box */
            for (m=1;m<=4;m++) {
               m1 = m;
               m2 = 0;
               if (m != 4)
                  m3 = m + 1;
               else
                  m3 = 1;
               if ((case_value = castab[sh[m1]+1][sh[m2]+1][sh[m3]+1]) == 0)
                  continue;
               switch (case_value) {
               case 1: /* Line between vertices 1 and 2 */
                   x1 = xh[m1];
                   y1 = yh[m1];
                   x2 = xh[m2];
                   y2 = yh[m2];
                   break;
               case 2: /* Line between vertices 2 and 3 */
                   x1 = xh[m2];
                   y1 = yh[m2];
                   x2 = xh[m3];
                   y2 = yh[m3];
                   break;
               case 3: /* Line between vertices 3 and 1 */
                   x1 = xh[m3];
                   y1 = yh[m3];
                   x2 = xh[m1];
                   y2 = yh[m1];
                   break;
               case 4: /* Line between vertex 1 and side 2-3 */
                   x1 = xh[m1];
                   y1 = yh[m1];
                   x2 = xsect(m2,m3);
                   y2 = ysect(m2,m3);
                   break;
               case 5: /* Line between vertex 2 and side 3-1 */
                   x1 = xh[m2];
                   y1 = yh[m2];
                   x2 = xsect(m3,m1);
                   y2 = ysect(m3,m1);
                   break;
               case 6: /* Line between vertex 3 and side 1-2 */
                   x1 = xh[m3];
                   y1 = yh[m3];
                   x2 = xsect(m1,m2);
                   y2 = ysect(m1,m2);
                   break;
               case 7: /* Line between sides 1-2 and 2-3 */
                   x1 = xsect(m1,m2);
                   y1 = ysect(m1,m2);
                   x2 = xsect(m2,m3);
                   y2 = ysect(m2,m3);
                   break;
               case 8: /* Line between sides 2-3 and 3-1 */
                   x1 = xsect(m2,m3);
                   y1 = ysect(m2,m3);
                   x2 = xsect(m3,m1);
                   y2 = ysect(m3,m1);
                   break;
               case 9: /* Line between sides 3-1 and 1-2 */
                   x1 = xsect(m3,m1);
                   y1 = ysect(m3,m1);
                   x2 = xsect(m1,m2);
                   y2 = ysect(m1,m2);
                   break;
               default:
                   break;
               }

               /* Finally draw the line */
               ConrecLine(x1,y1,x2,y2,z[k]);
            } /* m */
         } /* k - contour */
      } /* i */
   } /* j */
/*
* Conrec.java
*
* Created on 5 August 2001, 15:03
*
* Copyright (c) 1996-1997 Nicholas Yue
*
* This software is copyrighted by Nicholas Yue. This code is base on the work of
* Paul D. Bourke CONREC.F routine
*
* The authors hereby grant permission to use, copy, and distribute this
* software and its documentation for any purpose, provided that existing
* copyright notices are retained in all copies and that this notice is included
* verbatim in any distributions. Additionally, the authors grant permission to
* modify this software and its documentation for any purpose, provided that
* such modifications are not distributed without the explicit consent of the
* authors and that existing copyright notices are retained in all copies. Some
* of the algorithms implemented by this software are patented, observe all
* applicable patent law.
*
* IN NO EVENT SHALL THE AUTHORS OR DISTRIBUTORS BE LIABLE TO ANY PARTY FOR
* DIRECT, INDIRECT, SPECIAL, INCIDENTAL, OR CONSEQUENTIAL DAMAGES ARISING OUT
* OF THE USE OF THIS SOFTWARE, ITS DOCUMENTATION, OR ANY DERIVATIVES THEREOF,
* EVEN IF THE AUTHORS HAVE BEEN ADVISED OF THE POSSIBILITY OF SUCH DAMAGE.
*
* THE AUTHORS AND DISTRIBUTORS SPECIFICALLY DISCLAIM ANY WARRANTIES, INCLUDING,
* BUT NOT LIMITED TO, THE IMPLIED WARRANTIES OF MERCHANTABILITY, FITNESS FOR A
* PARTICULAR PURPOSE, AND NON-INFRINGEMENT. THIS SOFTWARE IS PROVIDED ON AN
* "AS IS" BASIS, AND THE AUTHORS AND DISTRIBUTORS HAVE NO OBLIGATION TO PROVIDE
* MAINTENANCE, SUPPORT, UPDATES, ENHANCEMENTS, OR MODIFICATIONS.
*/
/**
* Conrec a straightforward method of contouring some surface represented a regular
* triangular mesh.
*
* Ported from the C++ code by Nicholas Yue (see above copyright notice).
* @see http://paulbourke.net/papers/conrec for full description
* of code and original C++ source.
*
* @author Bradley White
* @version 1.0
*/
public class Conrec {
private double [] h = new double [5];
private int [] sh = new int [5];
private double [] xh = new double [5];
private double [] yh = new double [5];
// Object that knows how to draw the contour
private Render render = null;
/** Creates new Conrec */
public Conrec(Render render) throws Exception {
if (render == null){
throw new Exception ("Render null");
}
this.render = render;
}
/**
* contour is a contouring subroutine for rectangularily spaced data
*
* It emits calls to a line drawing subroutine supplied by the user
* which draws a contour map corresponding to real*4data on a randomly
* spaced rectangular grid. The coordinates emitted are in the same
* units given in the x() and y() arrays.
*
* Any number of contour levels may be specified but they must be
* in order of increasing value.
*
*
* @param d - matrix of data to contour
* @param ilb,iub,jlb,jub - index bounds of data matrix
*
* The following two, one dimensional arrays (x and y) contain the horizontal and
* vertical coordinates of each sample points.
* @param x - data matrix column coordinates
* @param y - data matrix row coordinates
* @param nc - number of contour levels
* @param z - contour levels in increasing order.
*
*/
public void contour(double [][] d, int ilb, int iub, int jlb, int jub, double [] x, double [] y, int nc, double [] z) {
int m1;
int m2;
int m3;
int case_value;
double dmin;
double dmax;
double x1 = 0.0;
double x2 = 0.0;
double y1 = 0.0;
double y2 = 0.0;
int i,j,k,m;
// The indexing of im and jm should be noted as it has to start from zero
// unlike the fortran counter part
int [] im = {0,1,1,0};
int [] jm = {0,0,1,1};
// Note that castab is arranged differently from the FORTRAN code because
// Fortran and C/C++ arrays are transposed of each other, in this case
// it is more tricky as castab is in 3 dimension
int [][][] castab=
{
{
{0,0,8},{0,2,5},{7,6,9}
},
{
{0,3,4},{1,3,1},{4,3,0}
},
{
{9,6,7},{5,2,0},{8,0,0}
}
};
for (j=(jub-1);j>=jlb;j--) {
for (i=ilb;i<=iub-1;i++) {
double temp1,temp2;
temp1 = Math.min(d[i][j],d[i][j+1]);
temp2 = Math.min(d[i+1][j],d[i+1][j+1]);
dmin = Math.min(temp1,temp2);
temp1 = Math.max(d[i][j],d[i][j+1]);
temp2 = Math.max(d[i+1][j],d[i+1][j+1]);
dmax = Math.max(temp1,temp2);
if (dmax>=z[0]&&dmin<=z[nc-1]) {
for (k=0;k=dmin&&z[k]<=dmax) {
for (m=4;m>=0;m--) {
if (m>0) {
// The indexing of im and jm should be noted as it has to
// start from zero
h[m] = d[i+im[m-1]][j+jm[m-1]]-z[k];
xh[m] = x[i+im[m-1]];
yh[m] = y[j+jm[m-1]];
} else {
h[0] = 0.25*(h[1]+h[2]+h[3]+h[4]);
xh[0]=0.5*(x[i]+x[i+1]);
yh[0]=0.5*(y[j]+y[j+1]);
}
if (h[m]>0.0) {
sh[m] = 1;
} else if (h[m]<0.0) {
sh[m] = -1;
} else
sh[m] = 0;
}
//
// Note: at this stage the relative heights of the corners and the
// centre are in the h array, and the corresponding coordinates are
// in the xh and yh arrays. The centre of the box is indexed by 0
// and the 4 corners by 1 to 4 as shown below.
// Each triangle is then indexed by the parameter m, and the 3
// vertices of each triangle are indexed by parameters m1,m2,and
// m3.
// It is assumed that the centre of the box is always vertex 2
// though this isimportant only when all 3 vertices lie exactly on
// the same contour level, in which case only the side of the box
// is drawn.
//
//
// vertex 4 +-------------------+ vertex 3
// | \ / |
// | \ m-3 / |
// | \ / |
// | \ / |
// | m=2 X m=2 | the centre is vertex 0
// | / \ |
// | / \ |
// | / m=1 \ |
// | / \ |
// vertex 1 +-------------------+ vertex 2
//
//
//
// Scan each triangle in the box
//
for (m=1;m<=4;m++) {
m1 = m;
m2 = 0;
if (m!=4) {
m3 = m+1;
} else {
m3 = 1;
}
case_value = castab[sh[m1]+1][sh[m2]+1][sh[m3]+1];
if (case_value!=0) {
switch (case_value) {
case 1: // Line between vertices 1 and 2
x1=xh[m1];
y1=yh[m1];
x2=xh[m2];
y2=yh[m2];
break;
case 2: // Line between vertices 2 and 3
x1=xh[m2];
y1=yh[m2];
x2=xh[m3];
y2=yh[m3];
break;
case 3: // Line between vertices 3 and 1
x1=xh[m3];
y1=yh[m3];
x2=xh[m1];
y2=yh[m1];
break;
case 4: // Line between vertex 1 and side 2-3
x1=xh[m1];
y1=yh[m1];
x2=xsect(m2,m3);
y2=ysect(m2,m3);
break;
case 5: // Line between vertex 2 and side 3-1
x1=xh[m2];
y1=yh[m2];
x2=xsect(m3,m1);
y2=ysect(m3,m1);
break;
case 6: // Line between vertex 3 and side 1-2
x1=xh[m3];
y1=yh[m3];
x2=xsect(m1,m2);
y2=ysect(m1,m2);
break;
case 7: // Line between sides 1-2 and 2-3
x1=xsect(m1,m2);
y1=ysect(m1,m2);
x2=xsect(m2,m3);
y2=ysect(m2,m3);
break;
case 8: // Line between sides 2-3 and 3-1
x1=xsect(m2,m3);
y1=ysect(m2,m3);
x2=xsect(m3,m1);
y2=ysect(m3,m1);
break;
case 9: // Line between sides 3-1 and 1-2
x1=xsect(m3,m1);
y1=ysect(m3,m1);
x2=xsect(m1,m2);
y2=ysect(m1,m2);
break;
default:
break;
}
// Put your processing code here and comment out the printf
//printf("%f %f %f %f %f\n",x1,y1,x2,y2,z[k]);
render.drawContour(x1,y1,x2,y2,z[k]);
}
}
}
}
}
}
}
}
private double xsect(int p1, int p2){
return (h[p2]*xh[p1]-h[p1]*xh[p2])/(h[p2]-h[p1]);
}
private double ysect(int p1, int p2){
return (h[p2]*yh[p1]-h[p1]*yh[p2])/(h[p2]-h[p1]);
}
}
最初のプログラムを下に示す。 20m毎の等高線を描こうとしているが、まだ、妥当な結果は得られていない。
m単位の標高を20で割って、数値が変わった所に等高線があると考えたものである。
注目画素と右、下、斜めの画素の標高を比較している。
斜めは値が変わることが多い。一方、右、下は注目画素と同じである。
標高値を見ると、右、下は妥当な値であるが、斜めが大きく異なっていることが多い。 同じ数値が続くことも多い。
添え字の i と j が逆になっていた。
 41.279999, 41.590000, 41.279999, 47.680000
 41.590000, 41.980000, 41.489998, 47.680000
 41.980000, 42.469997, 41.869999, 47.680000
 42.469997, 42.770000, 42.480000, 47.639999
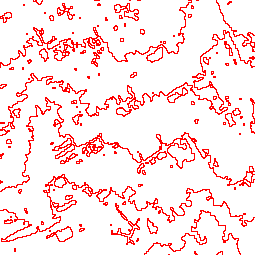
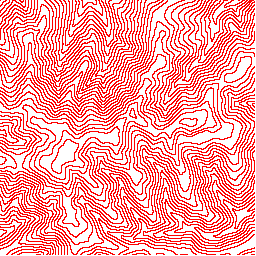
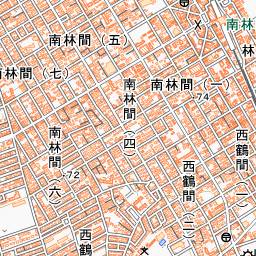
平地ゆえ、等高線を1m毎にした結果を下(左)に示す。東西にはほとんど高低差がない。 南北にはタイル全体で、4、5mの高低差がある。
右は等高線を10m毎にした東京の高尾山である。左より、中央より少し下に頂上がある。 この方法では、等高線に 100、200、... といった標高を数値を書き込むのは難しい。
100、200、… の等高線の色を標高により色を変えて、凡例を書き加えるのは比較的簡単である。
zoom 16、17 辺りでも等高線が欲しい。128x128画素、64x64画素の標高を 256x256画素に拡大すれば、 zoom 15 と同じ方法が使える。4画素あるいは16画素の標高を同じにした場合、ギザギザがもっと目立ち、 誤差が大きくなる。周辺の値を使って、4画素あるいは16画素の標高を算出すべきであろう。
1mメッシュの標高タイルが日本全土で使えるようになれば、この問題は解決する。
現在のプログラムでは、注目画素と右、下、斜めに等高線が横切る場合、常に、注目画素を塗りつぶしている。 例えば、右に近い場合、右を塗りつぶした方がギザギザが目立たないかもしれない。 しかし、このような姑息なことはしない方が無難かも知れない。
等高線を求めて、それを滑らかにして、アンチエイリアスで描画すれば、任意の太さのなめらかな等高線が描ける。 レンダリングに使っているプログラムを使って、等高線に 100、200、... といった標高を書き加えることもできる。
// レンダリング
        if (zoom == 15 && map.drawContour) {
            boolean success = Contour.getElevations(tile.x, tile.y);
            if (success) {
                Bitmap bmp = Contour.getContour();
                String dir = Map.DIR + "contour/15/" + tile.x;
                String path = dir + "/" + tile.y + ".png";
                Contour.saveBitmap(dir, path, bmp);
            }
        }


public class Contour {
    static float[][] ele = new float[256][256];
    static Bitmap bmp = Bitmap.createBitmap(256, 256, Bitmap.Config.ARGB_8888);

    static Bitmap getContour() {
        for (int j = 0; j < 255; j++) {
            for (int i = 0; i < 255; i++) {
                float c = ele[j][i];        // check pixel
                float r = ele[j][i+1];      // right pixel
                float d = ele[j+1][i];      // down
                //float g = ele[i+1][j+1];    // diagonal
                float g = ele[j+1][i+1];    // diagonal
                int ic = (int)(c/20);
                int ir = (int)(r/20);
                int id = (int)(d/20);
                int ig = (int)(g/20);
                boolean flag = (ic != ir) || (ic != id) || (ic != ig);
                bmp.setPixel(j, i, flag ? 0xffff0000 : 0x00000000);
            }
        }

        return bmp;
    }

    static boolean getElevations(int x, int y) {    // x, y : zoom 15 のタイル座標
        String dir = Map.DIR + "GSI/dem/dem5a/" + x;
        String path = dir + "/" + y + ".png";
        Bitmap bmp = Elevation.loadBitmap(path);
        if (bmp == null) {
            String url = "https://cyberjapandata.gsi.go.jp/xyz/dem5a_png/15/" + x +"/"+ y +".png";
            bmp = Elevation.download(url, dir, path);
        }
        if (bmp == null) {
            return false;
        }
        for (int i = 0; i < 256; i++) {
            for (int j = 0; j < 256; j++) {
                int p = bmp.getPixel(i, j);
                int v = Color.red(p)*(1<<16) + Color.green(p)*(1<<8) + Color.blue(p);
                ele[i][j] = v == (1<<23) ? Float.MIN_VALUE :  // 無効
                        v < (1<<23) ? v * 0.01f : (v - (1<<24)) * 0.01f;
            }
        }
        return true;
    }

    static void saveBitmap(String dir, String path, Bitmap bmp) {
        if (!new File(dir).exists()) {
            try {
                Files.createDirectories(Paths.get(dir));
            } catch (IOException e) {
                e.printStackTrace();
            }
        }
        try (FileOutputStream outStream = new FileOutputStream(path)) {
            bmp.compress(Bitmap.CompressFormat.PNG, 100, outStream);
        } catch (Exception ex) {
            ex.printStackTrace();
        }
    }
}
QGISなど、等高線を得るソフトはあるが、Android上の自作地図アプリに簡単に組み込むのは難しい。 色々検索しているが、今のところ、プログラムとしては Conrecしか見つかっていない。
まだ、完全には理解していないが、すこしずつ理解が進んでいる。 恐らく、引数 double[][] d には、標高タイルから求めた 256x256 の標高データを与えるのであろう。 double[] x、double[] y には、それぞれ 256 要素で、画素の世界座標または、0から1を 256分割した値、 即ち、0, 1/256, 2/256, ... , 255/256 とすればよいのであろう。 double[] z には、10m毎の等高線を求める場合には 0, 10, 20, ... を入れておくのであろう。 この予測が正しいかどうか、もう少し、時間をかけて、Conrecプログラムをチェックしてから、 実際にプログラムを書いて試したい。急ぐ話ではないので、十二分に時間をかける。
Conrecは立体のワイヤーフレームなどにも使える汎用的なものであり、 十分理解した段階で地図専用のプログラムにしたい。
まずは、前の章に載せた class Conrec をそのままコピーして使う。 ただし、Android Java と本家Javaでは仕様が異なるところがあるので、必要に応じて、最小限の修正は行う。 double型は場合によっては float型に変える。
Renderだけ除いた。コンパイルエラーはない。
先頭で、bmp、canvas、paint を生成しておく。
    public Bitmap contour(double [][] d, int ilb, int iub, int jlb, int jub,
                        double [] x, double [] y, int nc, double [] z) {

        Bitmap bmp = Bitmap.createBitmap(256, 256, Bitmap.Config.ARGB_8888);
        Canvas canvas = new Canvas(bmp);
        Paint paint = new Paint(Paint.ANTI_ALIAS_FLAG);
        paint.setStyle(Paint.Style.STROKE);
        paint.setStrokeWidth(1);
        paint.setColor(Color.RED);

    }
render.drawContour() を canvas.drawLine() に変更する。
      //render.drawContour(x1,y1,x2,y2,z[k]);
      canvas.drawLine((float)x1, (float)y1, (float)x2, (float)y2, paint);
以下のようにして、引数とする値を求める。これにより、Bitmap bmp が得られる。
    Bitmap contour(int tx, int ty) {
        double[][] ele = getElevations(tx, ty);
        if (ele == null) {
            return null;
        }
        double[] x = new double[256];
        double[] y = new double[256];
        double[] z = new double[100];
        for (int n = 0; n < 256; n++) {
            x[n] = n + 0.5;
            y[n] = n + 0.5;
        }
        for (int n = 0; n < z.length; n++) {
            z[n] = n * 10;
        }
        Bitmap bmp = contour(ele, 0, 255, 0, 255, x, y, z.length, z);
        return bmp;
    }
画素にも大きさがある。国土地理院の標高は画素の中央の標高と考えると赤字の + 0.5 が加わる。 画素の原点(左上端)の標高と考えれば、+0.5 は要らない。
zoom 15では、0.5画素の違いであるから、見た目には区別がつかないほどの差である。 しかし、zoom 16では 1画素、zoom 17では2画素の差となる。
高尾山の等高線を求めた結果(zoom 15)を下に示す。
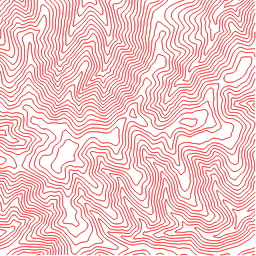

前のプログラムに比べて、等高線のギザギザはなくなり、滑らかな曲線となっている。
地図に直接、等高線を描くには、Canvas canvas を contourメソッドの引数とする。
    public void contour(double [][] d, int ilb, int iub, int jlb, int jub,
                        double [] x, double [] y, int nc, double [] z, Canvas canvas) {

        //Bitmap bmp = Bitmap.createBitmap(256, 256, Bitmap.Config.ARGB_8888);
        //Canvas canvas = new Canvas(bmp);
        Paint paint = new Paint(Paint.ANTI_ALIAS_FLAG);
        paint.setStyle(Paint.Style.STROKE);
        paint.setStrokeWidth(1);
        paint.setColor(Color.RED);

    }

    void contour(int tx, int ty, Canvas canvas) {
        double[][] ele = getElevations(tx, ty);
        if (ele == null) {
            return;
        }
        double[] x = new double[256];
        double[] y = new double[256];
        double[] z = new double[100];
        for (int n = 0; n < 256; n++) {
            x[n] = n + 0.5;
            y[n] = n + 0.5;
        }
        for (int n = 0; n < z.length; n++) {
            z[n] = n * 10;
        }
        contour(ele, 0, 255, 0, 255, x, y, z.length, z, canvas);
    }

        // 描画処理
        float width = ((int)z[k]) % 100 == 0 ? 2 : 1;
        paint.setStrokeWidth(width*Map.Scale);
        canvas.drawLine((float)x1, (float)y1, (float)x2, (float)y2, paint);
ほぼ中央に高尾山の頂上とした地図を下にしめす。よくよく見れば、タイル境界線のところで線が切れているのが分かる。 実際には、等高線はもっと目立たない色に変えるので、少なくとも zoom 15 では問題ないであろう。
zoom 16以上 でどうなるかはこれから調べる。
右図は、等高線の色を国土地理院地図の等高線の色としたものである。


Conrecの場合、対応は簡単である。
ハイズームほど、タイル境界線でのとぎれが目立つが、実用上問題になるほどではない。
zoom 14 では4標高タイル、zoom 13 では16標高タイルを使えば等高線を描画できるが、 ニーズは少ないので、当面、zoom 15以上の対応でよい。
dem5aは今のところ、日本全土をサポートしているわけではない。 しかし、そういう場所に自分が行くとは思えない。 また、山ではスマホの電波が届かないことがよくある。 電波が届くところで、一度でも地図で見た地域は、標高タイル画像ファイルがSDカードに保存されるので、 問題ないであろう。OSM地図は電波が届かなくても表示される。 等高線は必須というわけではないので、万一に備える必要はないだろう。
標高表示では、dem5a がなければ、dem5b、dem5c、dem10b を使うようにしているが、 そこまでする必要はないだろう。現在のプログラムでは dem5a による等高線だけを描いている。
    void contour(int tz, int tx, int ty, Canvas canvas) {
        if (tz <= 14) return;
        int fact = 1 << (tz - 15);
        double[][] ele = getElevations(tz, tx, ty);
        if (ele == null) return;
        double[] x = new double[256/fact];
        double[] y = new double[256/fact];
        double[] z = new double[100];
        for (int n = 0; n < z.length; n++) {
            z[n] = n * 10;
        }
        for (int n = 0; n < 256/fact; n++) {
            x[n] = (n + 0.5) * fact * Map.Scale;
            y[n] = (n + 0.5) * fact * Map.Scale;
        }
        contour(ele, 0, 256/fact - 1, 0, 256/fact - 1, x, y, z.length, z, canvas);
    }

    private double[][] getElevations(int z, int x, int y) {    // x, y : zoom 15 のタイル座標
        if (z <= 14) return null;
        int fact = 1 << (z - 15);
        String dir = Map.DIR + "GSI/dem/dem5a/" + x/fact;
        String path = dir + "/" + y/fact + ".png";
        Bitmap bmp = Elevation.loadBitmap(path);
        if (bmp == null) {
            String url = "https://cyberjapandata.gsi.go.jp/xyz/dem5a_png/15/"
                    + (x/fact) +"/"+ (y/fact) +".png";
            bmp = Elevation.download(url, dir, path);
        }
        if (bmp == null) {
            return null;
        }
        int bi = (x % fact) * (256/fact);
        int bj = (y % fact) * (256/fact);
        double[][] ele = new double[256/fact][256/fact];
        for (int i = 0; i < 256/fact; i++) {
            for (int j = 0; j < 256/fact; j++) {
                int p = bmp.getPixel(bi+i, bj+j);
                int v = Color.red(p)*(1<<16) + Color.green(p)*(1<<8) + Color.blue(p);
                ele[i][j] = v == (1<<23) ? Integer.MIN_VALUE :  // 無効
                        v < (1<<23) ? v * 0.01f : (v - (1<<24)) * 0.01f;
            }
        }
        return ele;
    }
等高線はもっと目立たない色に変えるので、タイル境界でのとぎれはもっと目立たなくなる。 しかし、ここでは、とぎれはなぜ起こるか、あえてなくするにはどうすればよいかを考える。
タイル(i,j)座標は縦横とも 256 であるのに対して、画素の中心座標は 0.5 ~ 255.5 である。 255.5 から次のタイル(i+1,j)の 0.5 の間でとぎれが起きる。 zoom 15の場合、隣の標高タイルの先頭画素の標高を 256.5 の標高とすれば、途切れがなくなる。
縦方向については標高タイル(i,j+1)の先頭列の標高を使う。 画素(255,255)に対しては標高タイル(i+1,j+1)の画素(0,0)の標高を使う。
わずかなとぎれをなくすために、右、下、斜めの標高タイルを読み込むのはコスパが悪い。
レンダリングは複数スレッドで行っており、右、下、斜めのタイルの処理は大抵は並行して、別のスレッドが行っている。 現行プログラムは等高線描画はスレッド毎に独立している。例えば、20標高タイルの座標をキャッシュして、 複数スレッドでこれを共用する方式を採る場合には、右、下、斜めの標高タイルのデータも簡単に取り出せる。
現行プログラムでは zoom 16以上では、複数のスレッドが同じ標高タイルファイルを読み込んでいることが多い。 これは非効率に見える。しかし、OSがディスクキャッシュをサポートしているため、 いずれかのスレッドが初めてある標高タイルファイルを読み込むには時間がかかるが、後続のスレッドが同じ ファイルを読み込む時間は短い。
自作地図アプリでは、OSMバイナリレコードおよびタイル画像に対してはそれぞれキャッシュを備えている。 これらのキャッシュはパフォーマンス上欠かせない。等高線表示については、OSのディスクキャッシュで十分である。
ただし、シンプルな標高タイルキャッシュを思いついたときは、キャッシュ方式に変えるかもしれない。
zoom 16以上では、zoom 15標高タイルの一部を切り出すため、大抵の場合、隣のタイル用の標高が簡単に得られる。
上記の方法では、とぎれが軽減されると思うが、なくならない可能性がある。隣のタイルの画素の座標は レンダリング中のタイルの座標の外にある。255.5 から 256.0 に相当する等高線は描画されるが、 256.0から256.5に相当する部分はタイルの外になり描画されない。0.5 からの描画ではなく、 前のタイルの 255.5 から このタイルの 0.5 までの描画も加える必要がある。
確か、国土地理院の標高タイルの標高はタイル毎の値であり、隣接タイルとの接合性は保証されていないといった記述をみた気がする。 したがって、タイル境界での継ぎ目に段差が現れる可能性がある。
しかし、zoom 16は zoom 15のタイルを縦横2分割するので、この分割線での途切れはなくせる。
zoom 16以上にも対応した。プログラム行数はさほど変わらないが、境界線処理が難しい。 応急処理で見た目には問題ないようにしたが、いずれ見直して分かりやすいプログラムにしたい。
zoom 16ではzoom 15の標高タイルを縦横2分したものを使う、この分割線では途切れがないようにした。 しかし、2x2タイル毎の境界線では途切れが起こる。zoom 17は分割が4x4となる。 内部の境界線(分割線)と外枠の境界線で扱いが異なるため、プログラムが難しい。 そのため、まだ、納得のいくプログラムになっていない。
できれば、等高線に 100、200、300 といった数値を書き込みたい。
100、200、300mの等高線に沿って、数値を、描くのは多少面倒であるが、水平方向に描くのは簡単である。
等高線の重要度はさほど高くないので、これでよいであろう。 タイル当たり、太線毎に、1回だけ描画した結果を下に示す。
